I am a new user to 12d and am interested in utilising 12d for the compilation of hydrographic surveying data sets.
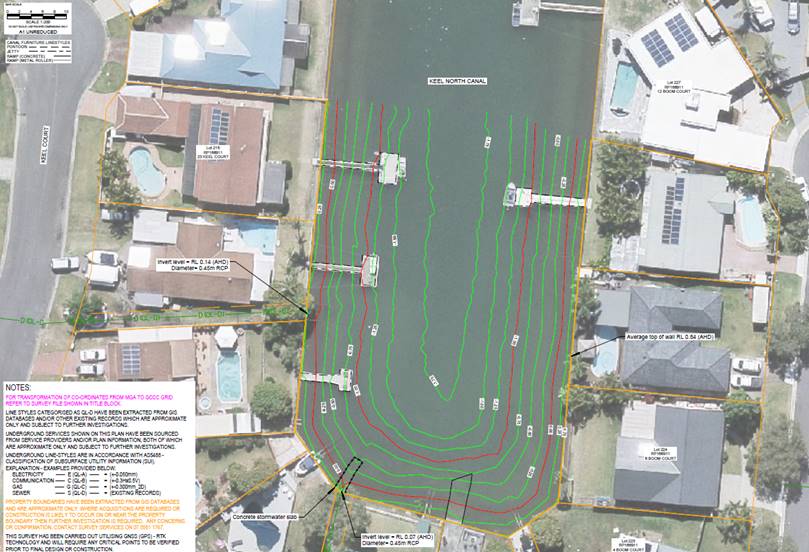
We are currently using 12d to present drawings as below however we do not present ‘soundings’ as such, only contours.
I would like to present our data with more in line with hydrographic nautical charting standards using 12d.
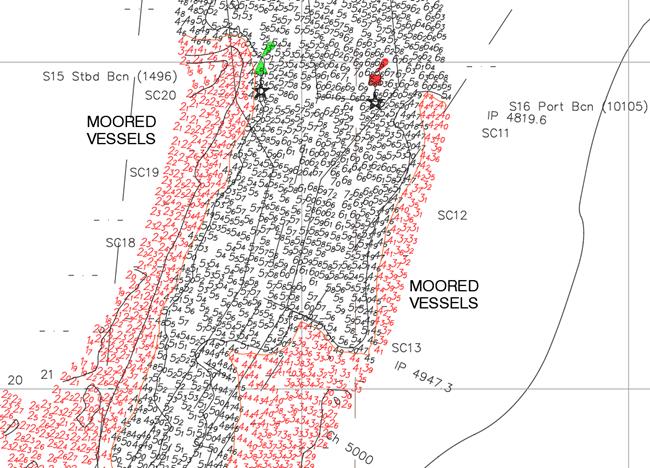
I would like to know if 12d is capable of presenting soundings as shown below in metres and decimetres rounded down. Eg 25.98 becomes 25.9.
Sounding

Additionally running a ‘clash’ routine to determine the shoalest sounding within a particular region and then present that sounding value without overwriting adjacent soundings.
Lots of places are still using Terramodel and the Hydrographic Data Management System (HDMS) to compile hydrographic drawings. I really feel that if these HDMS features were available in 12d it would be great. If anybody out there knows more about this please provide me with some advise.
Thanks in advance.